Phase I - Findings
February 20, 2015
Students were assessed on their knowledge on system of equations and inequalities. Students had four types of assessments to choose from. The first option students could choose from was the presentation. It required students to have a graph to explain system of equations and use a graph to explain system of inequalities. Students had to explain what the shaded areas mean, both the shared shaded area and ones with only one region not overlapped by another region. Students were graded on a rubric. This option was worth the same 25 points as the other three assessment options. Out of the 79 students, only 5 chose this option. This was originally designed for the students who chose the project option to express their learning through verbal communication. However, any student could sign up for this option. It’s interesting to note that out of the five students who chose this option, only one of them was from the project group. The other six students who were in the project group chose to take one of three paper-based quiz. The other three options were paper-based quizzes that were again split up in three categories: Just getting it, Getting it and Challenge me. These quizzes were all worth 25 points and mirrored the problem sets that shared its name.
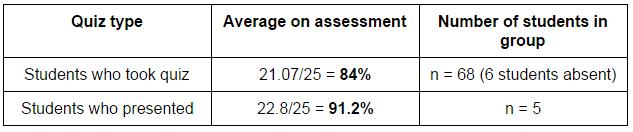
When comparing the two general types of assessments, presentation and paper-based, students did better on the presentation assessment. As table 1 below shows students scored a mean of 91.2% on the presentation assessment compared to an 84% on the paper-based quiz. It is noteworthy to look at the number of students who took each assessment. Only five students were assessed through the presentation.
Students were assessed on their knowledge on system of equations and inequalities. Students had four types of assessments to choose from. The first option students could choose from was the presentation. It required students to have a graph to explain system of equations and use a graph to explain system of inequalities. Students had to explain what the shaded areas mean, both the shared shaded area and ones with only one region not overlapped by another region. Students were graded on a rubric. This option was worth the same 25 points as the other three assessment options. Out of the 79 students, only 5 chose this option. This was originally designed for the students who chose the project option to express their learning through verbal communication. However, any student could sign up for this option. It’s interesting to note that out of the five students who chose this option, only one of them was from the project group. The other six students who were in the project group chose to take one of three paper-based quiz. The other three options were paper-based quizzes that were again split up in three categories: Just getting it, Getting it and Challenge me. These quizzes were all worth 25 points and mirrored the problem sets that shared its name.
When comparing the two general types of assessments, presentation and paper-based, students did better on the presentation assessment. As table 1 below shows students scored a mean of 91.2% on the presentation assessment compared to an 84% on the paper-based quiz. It is noteworthy to look at the number of students who took each assessment. Only five students were assessed through the presentation.
Table 1
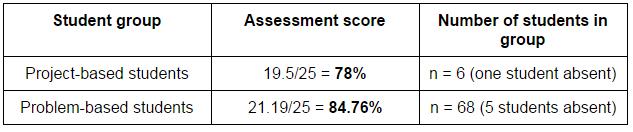
As mentioned before, the presentation assessment was designed for the project-based students in order to give them a fair assessment in their learning. However, only one of the seven project-based students chose the presentation. The other six took the paper-based quiz along with the problem and lecture group. The quiz directly mirrored what the students in that group were working on. As the results show in table 2, the project-based students didn’t score as high as the problem-based students. There was a noticeable difference in the scores. It is noteworthy to point out that the subject size is small for the project-based students.
Table 2
Project-based students were given the chance to choose their assessment. A majority chose to do a paper-based assessment, something they had not practiced. If students in the project-based group were mandated to do the presentation assessment, the change may have brought different results. However, if these students really understood the systems of equations and inequalities, one could come to the conclusion that it didn’t matter which type of assessment the project-based students chose. Like the other problem-based students, the students were able to choose the level of assessment they took: Just getting it, Getting it and Challenge me. The project-based students could choose an appropriate level of understanding that they would be assessed in. Another factor could be that the four assessments, while worth the same points, were scored and assessed different things. The Just getting it paper-based assessment asked students to simply graph one inequality on the x-y coordinate plane. The Challenge me paper-based asked students to graph a system of inequalities that are written in standard form and shade the solution area. The presentation assessment asked students to describe how to solve a system of inequalities, and students were able to prepare ahead of time the system they wanted to solve. Therefore, the different assessments could be a possible factor in the varying scores.
Another part of the assessment was a survey that asked students to give feedback on the structure of the class being divided up between project and problems and lecture. The students were also given a questionnaire on a five point Likert-scale. One of the questions was, “I feel challenged with the Math we are learning in class.” Another question asked “Math class should have projects.” The response of “1” meant students Totally Disagreed with the statement, “2” meant they Disagreed with the statement, “3” mean they were In the middle, “4” meant they Agreed with the statement, and “5” meant they Totally Agreed with the statement. In table 3 below, it shows the mean of the 51 students who returned the survey.
Another part of the assessment was a survey that asked students to give feedback on the structure of the class being divided up between project and problems and lecture. The students were also given a questionnaire on a five point Likert-scale. One of the questions was, “I feel challenged with the Math we are learning in class.” Another question asked “Math class should have projects.” The response of “1” meant students Totally Disagreed with the statement, “2” meant they Disagreed with the statement, “3” mean they were In the middle, “4” meant they Agreed with the statement, and “5” meant they Totally Agreed with the statement. In table 3 below, it shows the mean of the 51 students who returned the survey.
Table 3
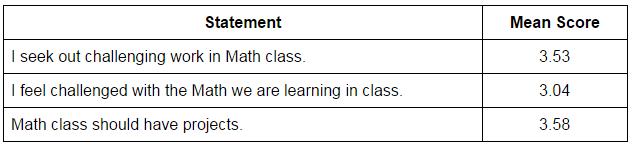
These results offer some insight into the students attitudes about the level of rigor of the math curriculum and the role of projects in math. On average, students felt like they were neither challenged too much nor challenged too little. It seems like there was a balance in regards to how students feel about the difficulty level in class. In regards to the last question it is important to note that the mode for the question was 5, which suggests that more people felt strongly about having math projects than those who didn’t want projects in math class. The fact that only 9% of my students chose to do the math project raises questions. If so many people feel strongly about having math projects, why were there only a small number of students who chose the math project option during this period of time? What about the project design, task or outcome made it unappealing to 91% of my students?
