Phase I - Description of Implementation
February 9 - 19, 2015
Out of the 79 students in my 9th grade classroom, 7 students chose the project-based learning option to learn about system of equations and inequalities. For two weeks this group explored the topic through a project that surrounded our theme of flight. Students learned about systems of equations and inequalities while gathering data about balloon buoyancy, weight and the number of balloons it would take to lift a student off the ground. Students were given a 5 gallon tank of helium, two bags of different sized balloons, a digital scale and ribbon. This small cohort of students ran tests about the combination of balloons and what weight each balloon could carry. Ounces were converted to pounds and then multiplied to give an answer. However, I added that one of the guidelines is that they have to use both balloons in their projection. Therefore, students had to create an equation with two variables, each of the variables representing a different size balloon - twelve and five inches.
Once students were able to generate an equation with a constant that applied to pounds, students chose the appropriate inequality of greater than to finish their inequality. There was a good discussion with students about what inequality symbol they should use. I offered the question of using an equal sign, but it was debated and ultimately turned down because they reasoned the balloons needed to be greater than the person’s weight in order to lift him/her. In order to create a system of inequalities I had students consider another factor, price. I showed them the receipt of the balloons and it was calculated that the larger balloons cost 11 cents each and the smaller balloons cost 5 cents each. Knowing how many balloons they would need, I gave them a budget of $20,000. Students were wide eyed when shown this number. I quickly reassured them this figure was just hypothetical.
Students used their two equations and graphed them on a graphing calculator. Fortunately, the website Desmos.com does a nice job of shading the particular region that represented solution areas for both inequalities. The students had a nice discussion on what areas of the x-y coordinate plane we would consider solutions. We would definitely consider any overlapping areas of both inequalities to be solutions to our question of the number of balloons and also the price. Graph two shows an example of a student graph.
Graph 2
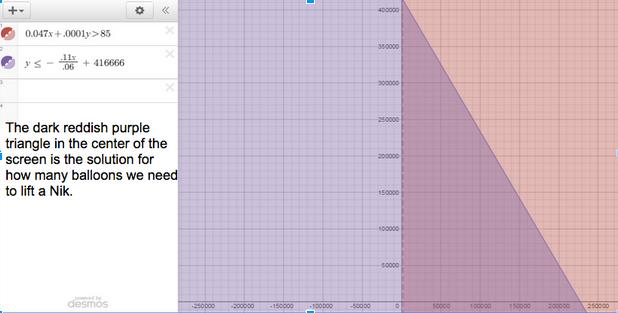
Quadrant I is represented in graph 2 because this is the only reasonable solution set. Solution areas in quadrant IV represents having negative balloons, which didn’t make sense in our case. Students presented their graphs and explained how any combination of twelve-inch balloons and five-inch balloons in the shared shaded area would be possible combinations that would fit the criteria of lifting a person and being under budget.
The other 91% of the students chose the option of problems and traditional lecture. For two weeks these students were presented with three categories of problems: Just getting it, Getting it and Challenge me. These differentiated problems were a collection of problems designed around our topic of system of equations and inequalities. For the first week the Just getting it problems focused on introducing students to a one variable representation of inequalities. Students used either open or closed circles to indicate whether a number was more/less than and more/less than and equal to. The students in this group then progressed to graphing two variables in an inequality on an x-y coordinate plane and shaded the appropriate area. The Getting it problems started off where the Just getting it problems ended, graphing one inequality on an x-y coordinate plane. Students then graphed two inequalities on the same graph and shaded the solution areas for both inequalities and highlighted the shared area. The Challenge me group were tasked with graphing two inequalities on the same graph, however the inequalities were given in standard form, instead of slope-intercept form. Students either had to rearrange the inequality or plug in zeros to find the points to graph and ultimately use to form a line.
These problems were presented to students as being available to anyone at anytime. Students would self-select which problems they would do. Overall, over 50% of them chose the Just getting it problems at first. I found during the first week of the intervention, students completed and went on to a second problem set. Less than one-third of students at a given moment during the intervention period were working on the Challenge me problems. Throughout the week the popularity of the first two problem types, Just getting it and Getting it was high, with the Challenge me problems consistently trailing in number of students attempting them.
