Phase II - Findings
March 25 - 27, 2015
The problem and lecture group were assessed on five topics regarding functions. These topics included explaining what a function is and isn’t, deciphering functions, how graphs relate to functions, piecewise functions and exponential functions. Students were given two options in how they would be assessed on their knowledge of these topics. The first option was a presentation of learning. Students could create a digital or paper presentation on these topics and submit it. They would have to explain what a function is and give an example. They would also have to explain what a function isn’t and provide an example. Their knowledge of decoding what the function notation means would need to be evident. If given a graph, students would need to be able to read the graph and provide a fictional story that could correspond with the various fluctuations of the graph. Students would need to show their knowledge of a piecewise function in regards to domain and range. Finally, they would have to compare the similarities and differences between a linear and exponential function. These five subtopics of functions would be assessed in the second assessment option, a quiz. Students who chose the second option would be able to take a five question quiz that had questions relating to the five topics. Both options were worth 25 points.
The project-based group were not given a choice in how they were assessed. The reason for this is because in Phase one, some of the project-based students chose an assessment that was intended for the problem and lecture group. I wanted to keep the assessment suitable for each group. The project-based group were given a rubric early in the phase and they were going to be assessed on their knowledge of Newton’s Three Laws of Motion and the lift, drag, thrust and weight principles. Students would build or design a flying object that incorporated their understanding of the laws and principles they had learned. The students would then present their creation and justify their design by incorporating their understanding of the laws of motion and the principles of flight. Students were graded on the depth of their understanding and whether they incorporated some, most or all of the laws and principles into their design and justification.
Table four shows the results of the two groups on their respective assessments.
Table 4
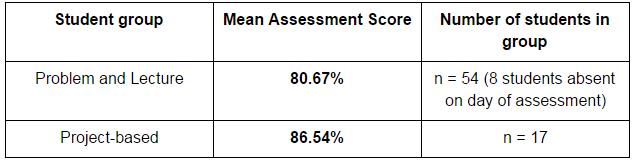
The average score on the assessment is higher for the project-based group. In Phase one, the project-based group had a lower average score on their assessment by an average of seven percentage points. In phase two, the two groups swapped positions. The project-based group scored higher than the problem-lecture group by almost six percentage points. One possible explanation for the drop in the mean assessment scores for the problem and lecture group is the type of math the students were doing. Drawing upon the definition of math proficiency mentioned earlier, the students in this group were not simply doing procedural fluency. Instead they were forced to adapt their reasoning of functions to a variety of problems. Instead of solving for functions, students were analyzing their graphs, making sense of its notation and comparing it with other types of functions. By adding other forms of math proficiency, students could have been challenged to do more with functions than simply solving them. In phase one, the assessment was strictly procedural fluency. Their mean scores were 84.76%. In phase two, the assessment asked students to write, compare and justify more. Their mean score was 80.67%
One possible explanation for the increase in the mean assessment scores of the project-based group is their assessment fit their project. In phase one, students were able to choose their assessment. Many of them chose the assessment from the other group. Taking a different assessment than the one designed for their group may have contributed to the average assessment score from phase one of 78%. In this phase, their assessment was specific to their project and that could be a contributing factor to this noticeable increase. Their mean score was 86.54%.
The students were also given a survey that focused on three things. First, I wanted to know whether or not their perceived level of being challenge changed from phase one. On a five-point Likert scale, students rated their answer to the statement, “I feel challenged with the math we are learning in class.” One represented “Totally disagree” and a 5 represented “Totally agree”. In phase one, there was a mean of 3.04 in response to this statement. In phase two, the mean was 3.39. There was a 12% increase in the perceived level of challenge. From the 46 students that returned the survey in phase two, it was clear that phase two’s problems and project were more challenging to the students. One possible explanation for this would be the types of activities that students were asked to do. Both groups were asked to synthesize their developing understanding into explanations, justifications and comparisons. This forces students to think more critically about the topic, instead of repeating procedural steps.
The second thing I wanted to know from the student survey is the reason behind the choice between the problem and lecture group and the project-based group. Graph 3 shows the reasons why the problem and lecture group chose this format of learning.
Graph 3
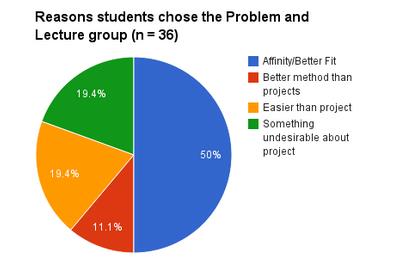
Half of the students either really enjoyed this style of learning or thought it was a better fit. This is helpful to understand why a large majority of my students chose this group in both phases. Talking to my students, they have commented on how this style is more of what they are used to. One student commented, "I wanted to do actual math problems and I like having lectures." The key word that stuck out to me was “like” in association with lectures. Another notable reason is almost a one-fifth of the 36 students that returned the survey said that they didn’t like something about the project. One student was very specific in her reason of why she went away from the project, "I work better when I don't have to present a project because I fear people might judge the quality of my work.” This student knows her fears and she opted to move away from a learning style that would put her in that position. Another notable comment that stuck out in my mind was a student wrote “I get taught more [with problems and lecture]”. This is interesting because of the word she used, “taught”. There is definitely more teaching going on with a traditional lecture style, but what about learning?
The students in the project-based group demonstrated a higher affinity towards doing projects. Graph four shows their results.
The students in the project-based group demonstrated a higher affinity towards doing projects. Graph four shows their results.
Graph 4
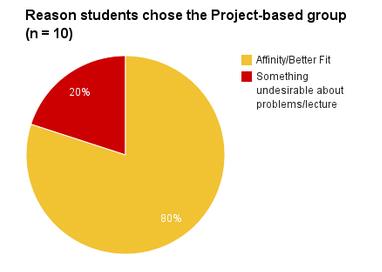
A majority of students expressed their desire to do the more “intriguing” and “interactive” option of projects opposed to problems and lecture. One student wrote that projects would “hold my attention”. Another student wrote that she “wanted a challenge”. Whatever the reason, it’s interesting to note that a majority of the 10 students that responded went toward the project-based group, instead of moving away from the other style of learning. One example of moving away from the problem and lecture style of learning is a student wrote that he was “bad at [taking a] test and it would be stressful.” Another student steered away from the problem and lecture group because the project group was “less pressure”.
