Phase II - Description of Implementation
February 23 - March 27, 2015
Students were presented with their choices of learning on February 23rd. The first choice was a problem and lecture format focused around the mathematical topic of functions. In the explanation I mentioned to them they would be following the Common Core Standards of learning functions for the next five weeks. On average, the students would have two lectures per week with around four to six activities per week. One of the results from phase one was that students felt the level of rigor of math class was average and “in the middle”. The problems that we used were more abstract, complex, rich and thoughtful. They were taken from a variety of sources that include, but are not limited to, the websites Illustrative Mathematics, Mathalicious and my colleagues at High Tech High. The intent would be to have students think more critically over fewer problems, instead of doing more problems that required lower levels of problem solving and perseverance.
The second choice was a project that would progress on our theme of flight. As mentioned before, in an effort to make the curriculum and tasks more challenging the project curriculum was borrowed from the National Aeronautics and Space Administration (NASA). Their series Flight Testing Newton’s Laws explains principles of flying and the math behind it. The lessons and problems use introductory trigonometry, kinematics, dynamics and vector addition, topics that the freshmen students have not learned. Through videos taught by NASA flight instructors, practical problems that go into designing and flying aircraft and a culminating project, students were tasked with learning about the math in flight.
Fifty-two students, or 78% of my students, selected the first option. This was a drop from the previous phase where 92% of the students chose the problem and lecture option. During this five week period the weeks were split up into numerical weeks. The first week students were introduced to functions by an activity called Graphing Stories, a website that has 15 second videos that encourages students to think about how to graphically represent them. Students viewed several videos and debated on the slope, domain and range of their graphs in the first quadrant. The week continued with tasks from the website Illustrative Mathematics where students were faced with deciding whether or not something was a function. There was a task called The Customers where students were given names and phone numbers. If someone were to be given a name, would they be able to locate one phone number for the person? If the answer was “yes”, which it was, then it would be a function. However, if someone were to be given a phone number, could they correctly identity the person? On the task there were two people that shared a phone number. The answer would be “no” and this would not be a function. Students grappled with this idea that a function’s input can only have one output.
The second week students were deciphering functions. What do the letters, parentheses, and numbers really mean? Students explored this idea with a task called Romeo and Juliet originally taken from the mathematics website, Mathalicious, and altered by me. Students were given a graph where the independent variable was “Time” and the dependent variable was “Love”. Students labeled the bottom part of the graph making time in months and numerically assigned values for love. As a class we wrote our own narrative of the two famed characters in love. We used r(t) and j(t) to represent Romeo’s love as a function of time and Juliet’s love as a function of time, respectively. Students created their own story about what happened as r(t) rose to equal 4, while j(t) sunk to 1. The week concluded with students using their creativity and problem solving skills to decide what the next figure would be in a patterned series of figures. This activity was taken from a website called Visual Patterns. Image one below represents an example of a function that is visually represented.
Image 1
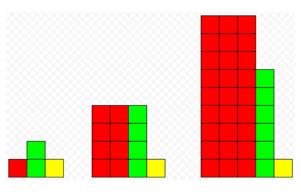
Not only are students tasked with figuring out the next figure in this pattern, but they are challenged to decipher the function equation. These tasks aimed to allow students to engage in functions and what they mean in a visual and meaningful way.
The third week students were exploring the definitions of a piecewise and step functions. Through the task Bank Account by Illustrative Mathematics, students were asked what would happen on a graph if a patron deposited cash? In respect to time and money as our axes, students drew from their experience in the initial weeks and drew a graph that had a vertical line or one that had a steep slope. We challenged the idea that a function could have a vertical line because there would be more than one output for an input. We also argued whether the steep slope would represent the instantaneous change in the bank account versus a gradual change in the bank account. Students finished off the week by creating their own scenarios where piecewise and step functions could be used.
The fourth week students learned about exponential functions. They tackled the myth that a paper could only be folded seven times by recording data on the number of regions in comparison to the number of folds. Using a TED talk as a reference, we asked the students how many folds would it take to reach the moon? Using exponential functions students were in the midst of seeing how each additional fold created a huge affect.
The final week of phase two, students reviewed for their assessment by completing a practice quiz or preparing their rough draft of a presentation of learning.
The project-based group were comprised of 17 students, or 22% of my students. Similar to the problem-based group the students tasks were outlined by weeks. The information was conveyed through videos by NASA pilots that used aircrafts and test flights to demonstrate concepts and show the use of math. In each of the subsequent weeks, students watched videos to introduce themselves to the concept and answered problems from the NASA curriculum. The first week students explored Newton’s Three Laws of Motion and were tasked with creating a video that demonstrated one of Newton’s laws. Students not only had to demonstrate their knowledge of a law, but also had to engage the audience with their demonstration and check for understanding.
The second week, students learned about one of the four aspects of flight, lift. Students learned about air density’s role, the lift coefficient, wing area and velocity and their role in creating lift. Problems that were posed gave students various criteria in a given situation and asked them at what speed would an aircraft need to travel in order to maintain lift. One problem in the set of lift problems utilized trigonometry to determine the angle of descent a plan was taking over 40 nautical miles.
In the third week, students explored the concepts of thrust and drag. Students took copious notes from the video. They wrote down pertinent equations, drawings of air molecules making contact on a wing and definitions of things like drag coefficient and jet engines. In a video on thrust the pilot outlined the various aspects of the thrust equation that include velocity, force, propeller constant, diameter of the propeller and the speed at which the propeller is moving. Image two below shows the thrust equation.
Image 2
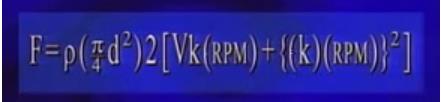
The pilot laid out all but one of the aforementioned values and asked the students to solve for the velocity needed for the plane to stay in the air. Students solved the problem along with the pilot and found the answer to be 47 knots. The pilot slowed down his plane to 47 knots and students could see how the plane dipped down and began to stall. This practical knowledge to the complex equation shows the importance of accuracy and precision.
In the fourth week, students learned about weight and balance. Knowing how to balance the plane and where to place things like the fuel tanks and wings, help the design of the airplane. Students learned that the wings ought to be placed at the center of gravity of the plane. Students also grappled with the question of what would happen when the fuel tank, once filled and weighing a lot, would dissipates and loses weight. How would that affect the weight and balance of the aircraft? Students incorporated this principle and the previous ones in their culminating project.
In the fourth week, students learned about weight and balance. Knowing how to balance the plane and where to place things like the fuel tanks and wings, help the design of the airplane. Students learned that the wings ought to be placed at the center of gravity of the plane. Students also grappled with the question of what would happen when the fuel tank, once filled and weighing a lot, would dissipates and loses weight. How would that affect the weight and balance of the aircraft? Students incorporated this principle and the previous ones in their culminating project.
